The functions are usually very generic and can handle lots of different argument types. This adds a lot of branching and validation which causes also a lot of overhead.
In this post we'll go through again the same example as in the previous post, but now we'll see how it's done by using MATLAB Profiler. As you may remember, we were looking for the number of matching elements between the needle (an array of five figures) and each row of the haystack (matrix containing one million rows, each having six figures between one and ten.)
Using intersect() the operation took 58 seconds. We can run the code in the MATLAB Profiler to find out which operations are included in the consumed time. This can be done by clicking "Run and Time" button in the MATLAB Code Editor.

After the code has been executed, we'll get the report from the Profiler. In the report, we'll see which lines have used the most of the time and which child functions are the most demanding.

It's quite clear that the most of the time was used in the intersect() function:

This can be seen also in another view having all the code lines, the number of calls and the amount of consumed time shown:

As we can see in the column which contains the consumed time, running the code via the MATLAB Profiler makes the execution a little bit slower. Instead of 58 seconds the execution took now 117 seconds, but we can still see the parts that have consumed the biggest amount of the execution time.
By clicking the intersect() in the Profiler view, we'll get the similar result of the consumed time inside the intersect().
Intersect() itself is a simple wrapper function. It checks the input arguments and calls a subfunction intersectR2012a() or intersectlegacy() with some option flags depending on the arguments. In this case the called function was intersectR2012a() as can be seen in the Profiler report:
Some part of the time was used in the validation of the arguments and parameters, but the most of the time was used inside the intersectR2012a(). As we click that function in the Profiler view, we'll get again a new report page:

This far, all the extra time was consumed by overheads caused by argument checking and the branching. These lines can be ignored if we know which branch is always used for our arguments.
After ignoring all the extra lines, we can see that the time consuming part of the remaining lines is mainly split between two different functions; ismember() and unique(). As we know from our data, calling the unique() is not required, so we can save a lot of time by calling ismember() only.
Also, we don't need to index our needle with the output of ismember() as the intersectR2012a() is doing. It's enough to call ismember(needle, haystack(row, :)). To verify this, we'll run the commands for a single row of the haystack:

The call with intersect() returned 1 and 3 as the figures of needle found in the haystack. Calling ismember() returned indices 1 and 3 which point to the same figures in the needle.
The modified code looks like this:

As it was mentioned in the previous post, the execution time with ismember() was reduced to 15 seconds. By continuing with Profiler, we can try to find even more overheads to remove:
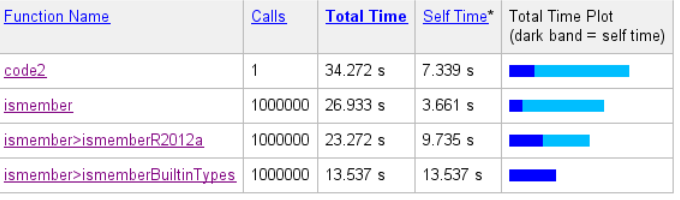

Again, as we have a simple combination of arguments, the branching in the function is simple and finally all the magic happens in a subfunction called ismemberR2012a(). In that function we'll find more unnecessary overhead. Here we can see one example of such lines which are not required for our known arguments but which seems to consume quite a big part of the execution time:
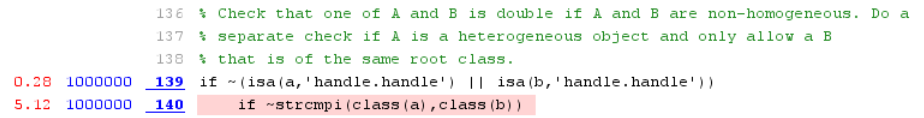
Another subfunction, so no wonder there's quite a lot of overhead in the function calls. In the ismemberBuiltInTypes() we see that some branching depends on the size of the first argument. In our case, the argument is needle. If the argument has more than six elements, the comparing of the arrays is done with a different method.

Because our needle contains only 5 figures, we would use this branch by default:

This is actually a method that was not used in our previous post. So we'll measure the execution time now.
Here's the code we use to test the performance with any()
for i = 1:length(haystack)
    match_ids = false(length(needle));
    for j = 1:length(needle)
        match_ids(j) = any(needle(j)==haystack(i, :));
    end
    matches = sum(match_ids);
    if matches > 0
        matchcount(matches) = matchcount(matches) + 1;
        numcount(match_ids) = numcount(match_ids) + 1;
    end
end
As you may remember, the execution time with ismember() was about 15 seconds and with _ismemberhelper() it was just below 8 seconds.
For any(), the execution time was between them; the average time for three runs was 12.88 seconds. So _ismemberhelper() seems to be clearly faster even though our array in the comparation was below the hardcoded branching limit of five elements. The comment of _ismemberhelper() section in the code is the following:

This is why we had the sorting included in the code using _ismemberhelper(). If the haystack would be sorted already before the execution, we could probably save few seconds more as can be seen in the Profiler report of the code having sort() and _ismemberhelper() in separate lines:

As we saw in this optimization experiment, there can be a lot of overhead in the MATLAB functions. Using the correct functions for the operations is already helping a lot (intersect() vs ismember() vs any()), but finding the best method requires effort.
NOTE: If the best method is an undocumented function, it may get deprecated in the future MATLAB versions or the behavior of the function may get changed. Therefore it's not recommended to use the undocumented functions in any production code.
No comments:
Post a Comment